Lightning risk assessment for solar farms
A solar farm is a field of small structures joined by long cables, full of inverters and controllers that fail at low surge levels. This guide shows how the IEC 62305-2:2024 risk method applies to one, why the cables usually carry more risk than the structures, and which measures the method credits.
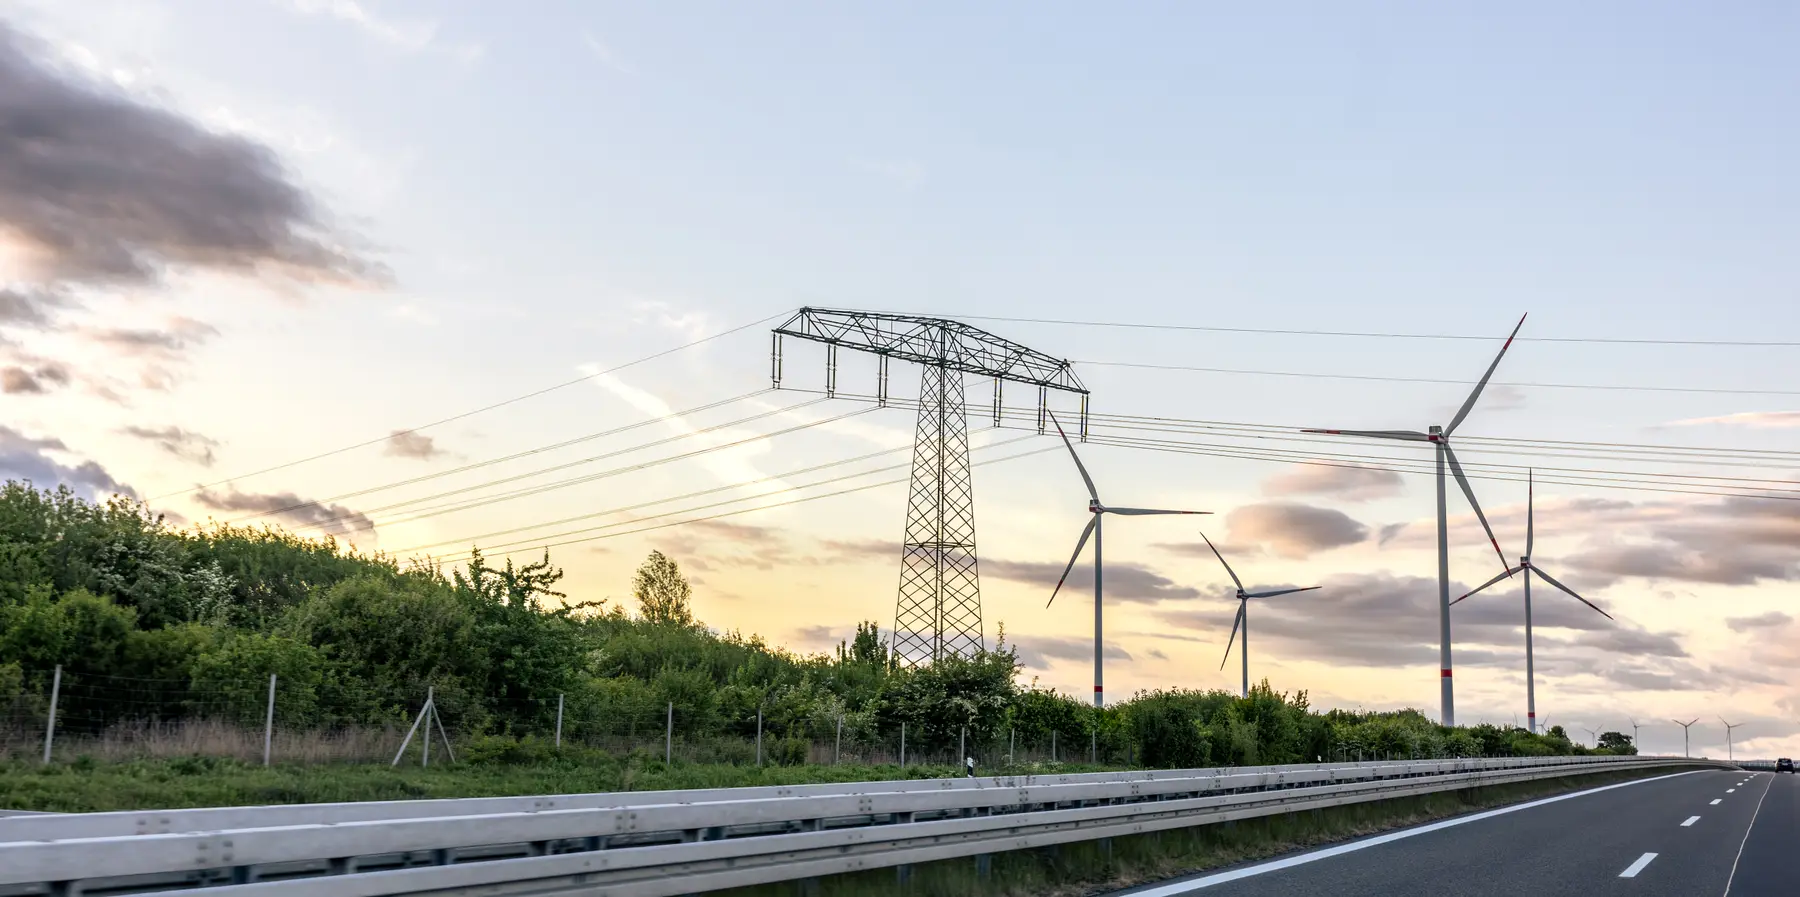
A lightning risk assessment for a solar farm is an IEC 62305-2 assessment of every structure on the site and every cable that joins them.
The method is the same one used for an office block or a hospital. What changes is the shape of the problem. A PV plant has few tall structures and few people, but it has kilometres of cable and hundreds of devices built around power electronics. The parts of the IEC 62305-2:2024 method that a single building barely tests, the connected lines and the frequency of damage to internal systems, are the parts that decide a solar farm's result.
This guide goes through the assessment in the order the method runs: what to assess, how often dangerous events occur, what is at stake, and which protection measures lower the figures. For the wider picture across solar, wind and substations, read lightning risk assessment for renewable energy.
A site is a set of structures and the lines between them
IEC 62305-2:2024 assesses a structure, its zones and its connected lines. On a solar farm that means several structures, each assessed in its own right, with the cables between them treated as lines.
Each structure on its own
Inverter stations, the control building and the substation are separate structures with their own size, location and contents. Each gets its own risk R and frequency of damage F, so a fault in one result never hides behind an average.
Each line separately
Clause 8.2 assesses each connected line on its own and adds the results. The DC and AC collection cables, the grid connection and any copper data cables each bring their own length, routing and line type into the calculation.
Zones inside a structure
Clause 8.3 lets you split a structure into risk zones where the floor, fire compartment or shielding changes. A control building may hold an equipment room and an office with very different losses and very different protection.
AS 1768:2021 reaches the same answer by a different route. Its clause 2.5.4.2 calls a ground-mounted PV array a distributed facility and says its spreadsheet should be run on each standalone structure, not on the site as a whole. Under IEC 62305-2:2024 the per-structure approach follows from what the method models.
Why the cables usually outweigh the structures
The number of dangerous events per year starts from the ground strike-point density NSG of the site (clause A.1) and multiplies it by a collection area. A structure collects direct flashes over its footprint plus a band three times its height around it (equation (A.3)). A cable collects flashes along its whole length: 40 times its length for flashes to the line (equation (A.10)), and a much wider strip for flashes near it (equation (A.12)).
An illustration shows the scale. The inputs are invented, the equations are the standard's. Take a site with an NSG of 4 strike points per square kilometre per year, an isolated inverter station 12 m long, 3 m wide and 3 m high, and a 500 m buried cable feeding it, with equipment rated for an impulse withstand voltage UW of 2.5 kV.
- Direct flashes to the station, ND: its collection area AD is about 560 m², so with a location factor of 1 for an isolated structure (Table A.1) it expects about 0.002 direct flashes a year (equation (A.5)).
- Flashes to the cable, NL: AL = 40 × 500 = 20,000 m². With the buried installation factor of 0.3 (Table A.2) and a rural environment factor of 1 (Table A.4), that is about 0.024 events a year (equation (A.9)), ten times the direct figure.
- Flashes near the cable, NI: at 2.5 kV the lateral distance rI is about 384 m, so AI is about 384,000 m², and the cable sees about 0.23 events a year (equation (A.11)), around a hundred times the direct figure.
Real sites have many more cables than this, and every one of them adds its own events. That is why a solar farm assessment turns on the line inputs: their lengths, whether they run aerial or buried, the line type, and the withstand voltage of the equipment at each end.
Risk to people, and the frequency of damage to the plant
IEC 62305-2:2024 judges two different things. The risk R covers injury to people and physical damage, and is compared with the tolerable risk RT, for which clause 7.3 NOTE 1 gives a representative value of 10⁻⁵ per year. The frequency of damage F counts how often a strike is expected to make an internal system fail, and is compared with the tolerable frequency FT (clause 9.3).
On a solar farm the two can point in different directions. People are on site only for operation and maintenance, and the time a person spends in a zone, tz, scales the components that involve people (equation (B.14)). The internal systems, the inverters, tracker controllers, monitoring and SCADA, are there all year. The frequency of damage F is built from dangerous events and probabilities of damage (equation (13)), and on a site with long cables and low withstand voltages it is often the figure that decides what protection is needed.
Clause 9.3 NOTE 1 gives representative values of FT: 0.1 failures a year for internal systems critical to the service and 1 a year for the rest. NOTE 2 lets the owner set the value by how much downtime the service can bear. For a generating plant, that is a commercial decision worth recording in the report. Whether an outage also counts as loss of service to the public, the type of loss L2 of clause 5.3, is a judgement for the owner and the authority having jurisdiction.
The measures the method credits
Each protection measure enters the calculation as a factor from a table in IEC 62305-2:2024. These are the ones that tend to move a solar farm's figures, with the table that sets each.
| Measure | What it changes | How the method credits it | Source |
|---|---|---|---|
| Bury the cables | Dangerous events on each line, NL and NI | Installation factor CI: 1 for aerial, 0.3 for buried | Table A.2 |
| Run buried cables inside a meshed earth termination | Dangerous events on each line | CI falls to 0.01 for cables running entirely within the mesh | Table A.2 |
| Coordinated SPDs on the internal systems | Probability that a surge damages the equipment | PSPD from 1 with no SPDs to 0.05 for LPL III to IV, 0.02 for LPL II and 0.01 for LPL I | Table B.7 (power), Table B.8 (telecom) |
| A lightning protection system on a structure | Probability of physical damage from a direct flash | PLPS from 1 unprotected to 0.2, 0.1, 0.05 and 0.02 for Class IV to I | Table B.3 |
| A thunderstorm warning system with evacuation | Components that involve people on site | PTWS below 1 only where a quick and full evacuation of the exposed area is ensured | Equations (B.2), (B.3), (B.10) to (B.12) and their NOTEs |
Each cell is our summary of the table cited, IEC 62305-2:2024 (Ed.3). A warning system earns no credit when the evacuation is not ensured or the manufacturer does not declare its performance. For how SPDs are chosen and placed, read SPD types 1, 2 and 3; for the earthing that a meshed earth termination is part of, read earthing for lightning protection.
The same site under the US and Australian standards
A US project often follows NFPA 780-2026, which writes binding rules for solar arrays into Chapter 12: strike termination devices on or beside the array, PV surge protective devices rated 20 kA (8/20) on each mode (12.4.2.1.1), and a ground ring around a ground-mounted array with a metal structure (12.5.1.1). Its risk assessment, Annex L, is informative and lists energy facilities among the critical facilities that should be protected or taken through the detailed method (L.5.3.1, L.5.3.2). The clause-by-clause guide is NFPA 780 solar arrays.
An Australian project follows AS 1768:2021. Appendix N is brief and informative, and refers the array itself to AS/NZS 5033. The clause that shapes the assessment is 2.5.4.2: estimate the yearly flashes to the whole site from its area and Ng, protect equipment and the cables between structures under Section 4, and run the spreadsheet on each standalone structure. Read solar PV lightning protection in Australia for the detail.
One project, every structure assessed
Questions answered
Do solar farms need a lightning risk assessment?
How is a solar farm assessed under IEC 62305-2?
Which part of a solar farm carries most of the lightning risk?
Does burying the cables reduce the lightning risk?
What tolerable frequency of damage applies to a solar farm's inverters?
What do NFPA 780 and AS 1768 say about solar farms?
Can Lumex™ assess a whole solar farm?
The tolerable risk in IEC 62305-2 is not a fixed constant.
Clause 7.3 NOTE 1 gives RT = 1 × 10⁻⁵ per year as a
representative value of tolerable risk and adds that another value may be set once
the case has been investigated in detail. Printed p.12 then lets national or local regulations fix
RT, the tolerable frequency of damage FT
Get started today